Draw trendlines
This FAQ contains the following information:
 What are trendlines?
Trendlines are lines you can add to the chart to mark times or prices, or to help identify trends in the movement of currency prices.
Why use trendlines?
Trendlines can be used for many different purposes:
Directional indicators: Peaks or troughs over a particular period may be joined with a trendline to identify the general direction. For example, if the trendline is a downward sloping line and the curve breaks the trend by rising above the line, this might be seen as a buying opportunity. Conversely, if the trendline is an upward sloping line and the curve breaks the trend by dropping below the line, this might be seen as a selling opportunity.
Support and resistance lines: When the price goes below trendlines horizontally drawn across previous lows, it may be a selling opportunity. Conversely, when the price goes above trendlines horizontally drawn across previous highs, it may be a buying opportunity.
Channels: If the currency price line stays between two parallel lines connecting peaks and troughs, this is a "channel" where fluctuations are "range-bound." If the currency price breaks out of this channel, it could be considered a signal of a change in direction.
How to add trendlines
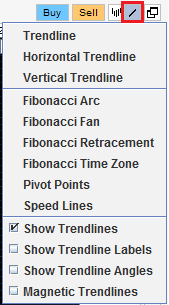
To work with trendlines, click the [/] button located in the top right corner above the graph. A menu appears for you to choose from available trendlines and choose trendline options:
To draw horizontal or vertical trendlines, choose their menu item, move the cursor to the place on the graph where you want to place the trendline, and then click once.
To draw other types of trendlines, choose their menu item, move the cursor to the place on the graph where you want to start the trendline, and then click once. Then move the cursor to the place where you want the trendline to end, and click again.
Types of trendlines
For detailed information on every type of trendline, go to the Forex indicators web pages.
Basic trendlines
Basic trendlines are straight lines that you can draw on the graph to mark times, values, or trends. The following basic trendlines are available from the Trendlines menu:
-
Vertical trendline: Used to mark a time period.
-
Horizontal trendline: Used to mark a price.
-
Trendline: A diagonal line to mark trends or movement on the graph. (You can set trendlines to "auto-extend" left or right from the User Preferences Chart tab.)
Advanced trendlines
Advanced trendlines include the following:
-
Fibonacci Arc
-
Fibonacci Fan
-
Fibonacci Retracement
-
Fibonacci Time Zone
-
Pivot Points
-
Speed Lines
For information on these more sophisticated trendlines, go to the Forex indicators web pages.
To include a numbered label on advanced trendlines (so you can distinguish them from each other), select the Show Trendline Labels check box in the Trendlines menu.
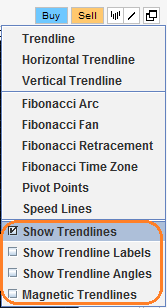
How to manage trendlines
Click the [/] button located in the top right corner above the graph. Use the bottom menu items to:
-
Show or hide trendlines
-
Show or hide trendline labels (available for advanced trendlines)
-
Turn on magnetic trendlines (so trendlines stick to the graph when you plot them)
-
Remove all trendlines for the currently viewed currency pair
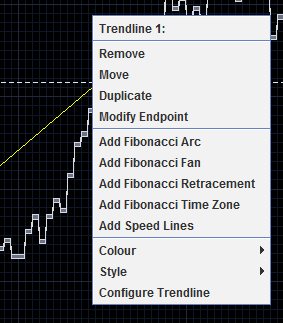
How to modify trendlines
Click over an existing trendline to modify it. A menu will appear.
Use this menu to:
-
Remove the trendline.
-
Move or duplicate the trendline. (Then click on the corresponding area on the chart where the trendline is to be moved or duplicated. Move the cursor outside of the graph area to cancel the action.)
-
Move the trendline's endpoints.
-
Add a Fibonacci study or Speed Lines to the trendline, or remove them.
-
Change the line's colour or styles.