Use overlay and indicator studies
There are a number of overlays and indicators to help you interpret your chart.
-
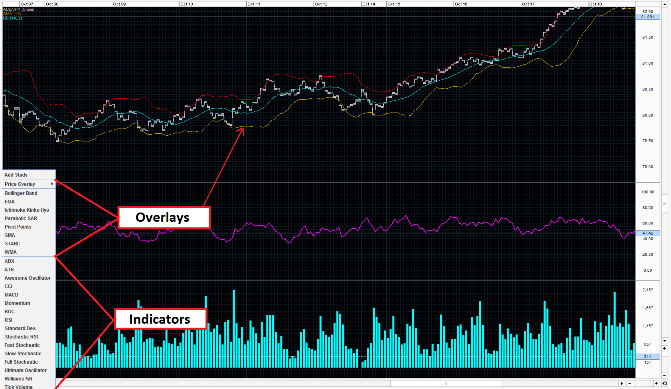
Overlays are positioned directly over the price curve. You can see their value at the cursor in the upper left hand corner.
-
Indicators are separate curves appearing under the price curve.
 Add an overlay or indicator
-
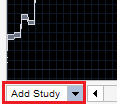
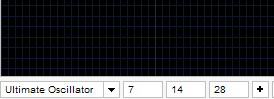
Click the drop-down arrow for the menu located in the bottom-left corner of the graph.
If you can't see this menu, you may need to switch to the advanced chart view. Click the Chart Options button located in the top-right corner above the graph, and select Advanced Chart View from its menu. -
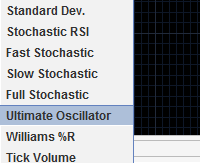
Select the overlay or indicator type from the menu that appears.
-
A set of parameters appears to the right of the menu. These parameters are unique for each study.
-
Click to (+) add the study to the chart area.

Modify or remove an overlay or indicator
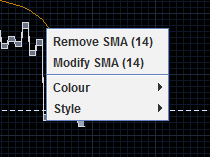
To remove an overlay or indicator from the graph, click over it and select Remove from the pop-up menu that appears:
Use this same menu to modify the values used to plot the overlay or indicator, or to change the colours and styles it uses.
(To change the default colours used by the charting interface, select Tools > Colour Scheme > Edit Custom Theme. )