Renko charts
This FAQ contains the following information:
 What are renko charts?
Renko charts are a chart type that only measures price movement. Additional, more traditional charting elements such as time or volume are not present. The word renko is derived from the Japanese word “renga” which means “bricks”. Not so coincidentally, renko charts are constructed from a series of bricks whose creation is determined by fluctuations in price. The concept of renko bars is very straightforward. First, the size of the bricks is pre-determined by the user. Once price moves more than the user defined “brick size” either above or below the most recent brick, a new brick is added to the chart.
It is important to note that new bricks are only added when price movements completely “fill” the predetermined “brick size”. Prices may exceed the values of the previous brick (either above or below), however a new brick will not be formed until the price movement is large enough. For example, let’s say the brick size is set to 2 points and the last brick covers prices of $52 to $54. The new brick won’t be formed until prices close either at or above $56 or at or below $50. If price closes above $56, for example $57; the new brick must still stop at $56.
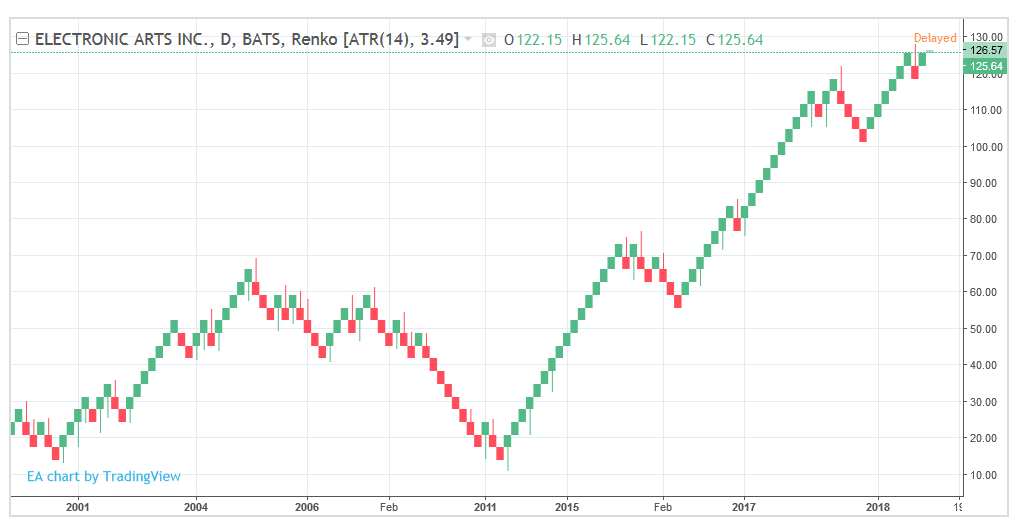
There are two rules regarding brick placement:
-
Bricks will always have their corners touching.
-
There can never be more than one brick in any one vertical column.
 Brick types
There are four different types of bricks generated by a renko chart:
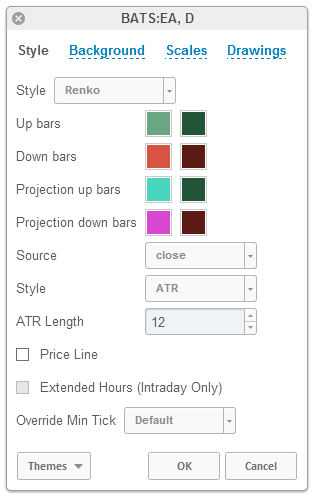
Up bricks – bricks that forms above the previous brick.
Down bricks – bricks that form below the previous brick
Projection up bricks – during an intraday timeframe, a potential up brick that would form based on current price (before actual closing price is set).
Projection down bricks – during an intraday timeframe, a potential down brick that would form based on current price (before actual closing price is set).
 Brick calculation methods
There are two different method for bricks to be calculated:
-
Average true range (ATR) – uses the values generated by the average true range (ATR) indicator. The ATR is used to filter out the normal noise or volatility of a financial instrument. The ATR method “automatically” determines a good brick size. It calculates what the ATR value would be in a regular candlestick chart and then makes this value the brick size.
-
Traditional – Uses a user-pre-defined absolute value for brick size. New bricks are only created when price movement is at least as large as the pre-determined brick size. The upside to this method is that it is very straightforward and it is easy to anticipate when and where new bricks will form. The downside is that selecting the correct brick size for a specific instrument will take some experimentation. Typically, you will want to select a brick size that is about 1/20th of the current value of the instrument.
 Renko chart uses
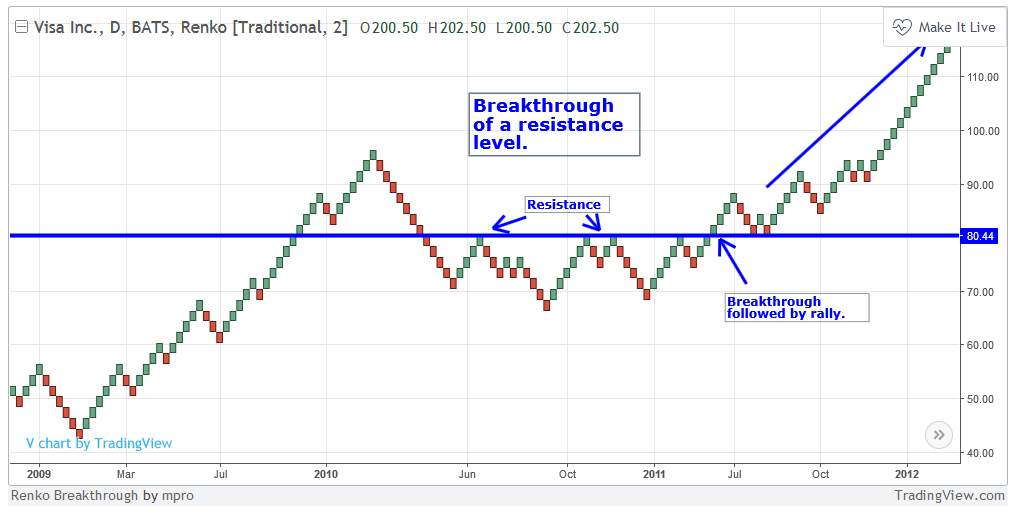
Traders who use renko charts typically do so because they are easy to use and interpret. They are also different than a typical candlestick chart because they filter out all other variables besides price movement. There are many uses for renko charts. Some of the more popular are; discovering basic support and resistance levels, breakouts, and generating signals with additional indicators.
 Support and resistance levels
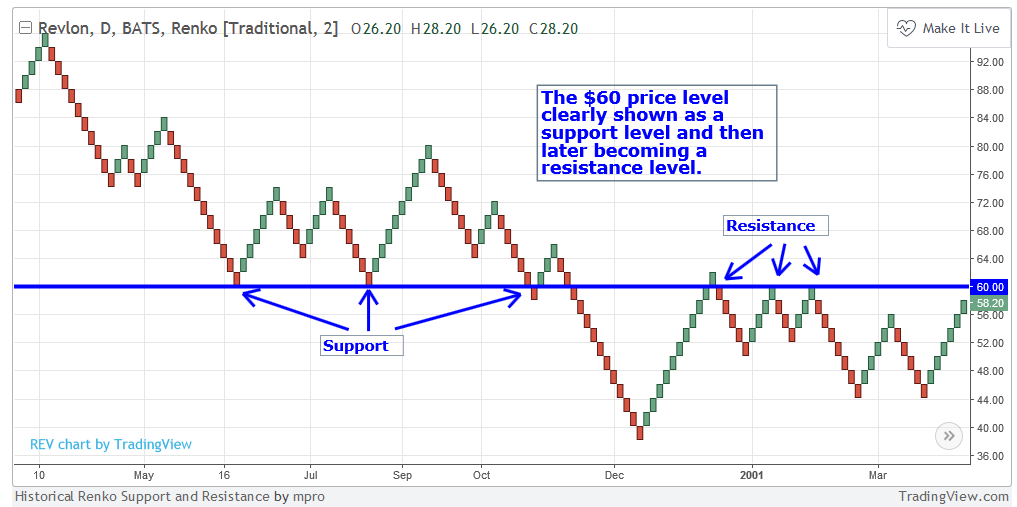
Frequently, when using renko charts, trading ranges appear when bars are generated between levels of support and resistance.
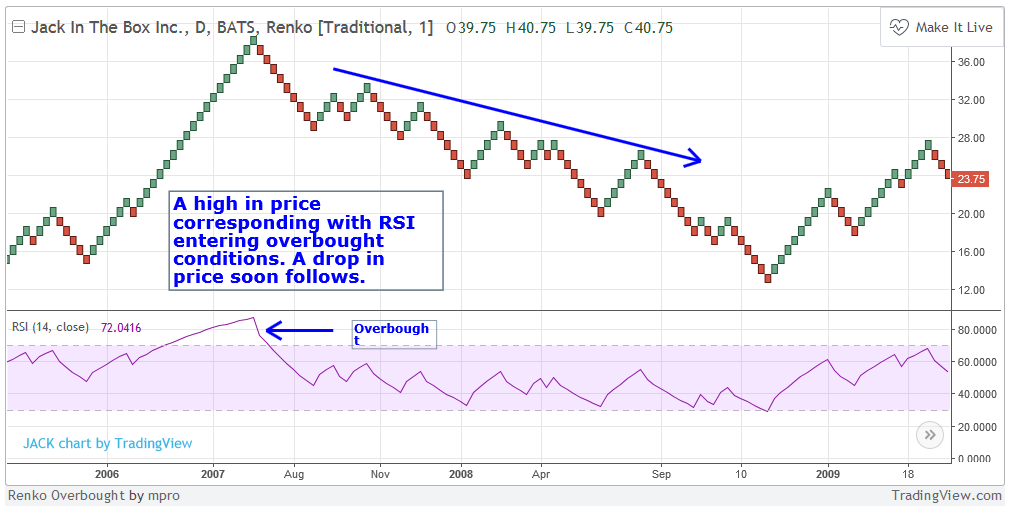
Overbought/oversold is a good example of using additional indicators within a renko chart to identify trade signals would be using the RSI in conjunction with renko bars to define overbought or oversold levels.
 Renko chart options
Up bricks – change the color and outline of up bricks
Down bricks - change the color and outline of down bricks
Projected up bricks - change the color and outline of projected up bricks
Projected down bricks - change the color and outline of projected down bricks
Style – you can choose between the ATR brick calculation method and the traditional brick calculation method
ATR length – if ATR is the selected brick calculation method, this value will set the ATR look-back period. 14 is the default.
Brick size – if traditional is the selected brick calculation method, this value is the user defined brick size.
