User guide for OANDA web platform
 What are the requirements for using the OANDA web platform?
The OANDA web platform is compatible with the following web browsers:
-
Firefox version 60 or higher
-
Google Chrome version 65 or higher
-
Safari version 11 or higher
-
Internet Explorer version 11 or higher
-
Microsoft Edge version 16 or higher
How to log in
Refer to the login FAQs. If you are unable to log in, refer to our troubleshooting guide.
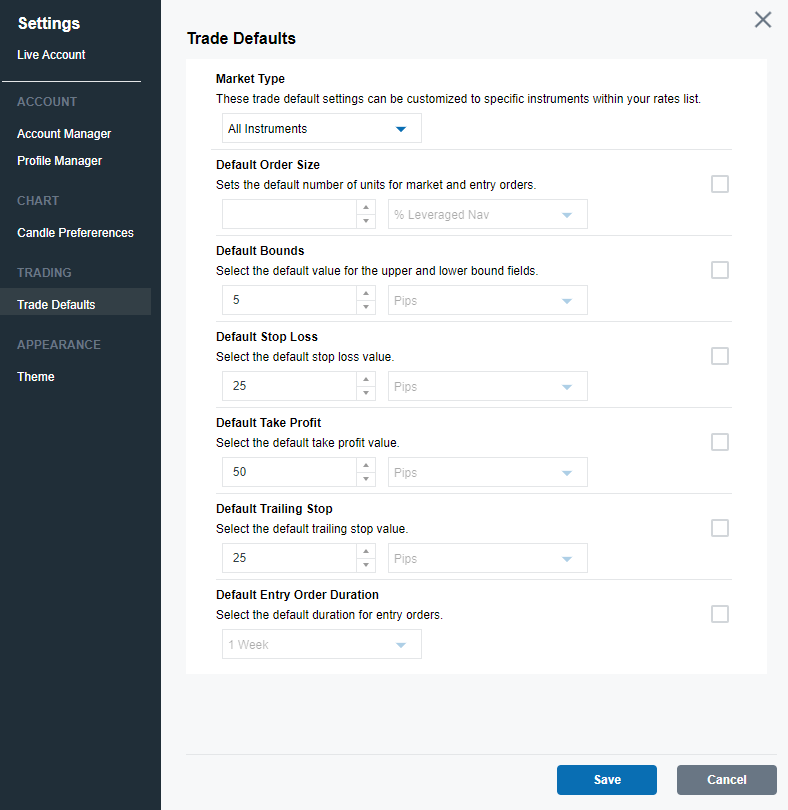
How to customize the OANDA web platform
This video shows how to customize the web platform, including:
-
customizing the rates window and the charting layout
-
zooming in and out
-
looking at past timeframes
-
changing timeframes
-
customizing indicators
-
moving the trade panel
-
changing the default trade size.
How to switch between sub-accounts
-
Click on the Accounts tab
-
If you have multiple sub-accounts, you can scroll up and down to find each one. Click on the account you want to switch to.
How to add funds
-
In the top panel, click on Manage Funds. You will be taken to the HUB.

-
Refer to our deposit guide for more information.
How to place a trade
-
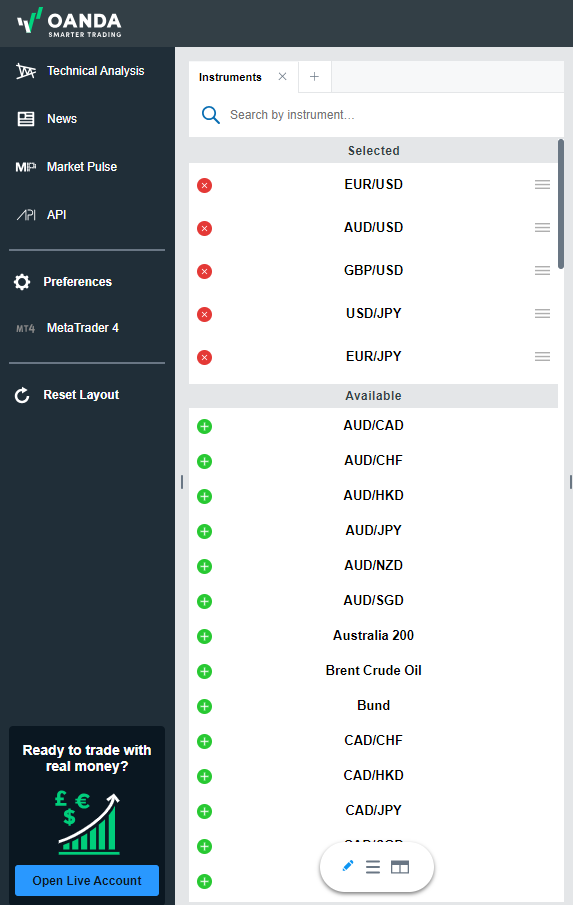
In the Instruments tab, you can see all the instruments you can trade in. Click on the different category tabs or the FAVORITES tab to find the relevant instruments.
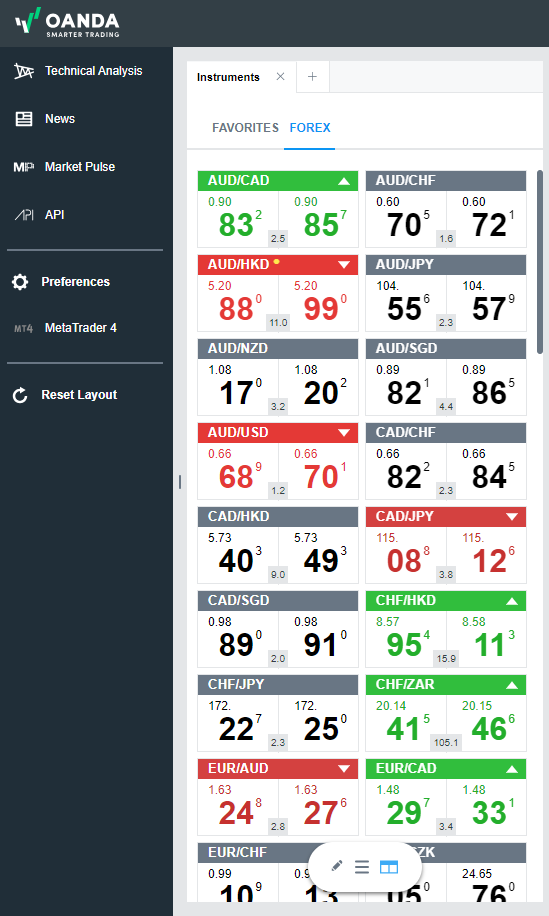
You can also use the pencil icon to search for a specific instrument for a specific instrument using the exact text and add it to FAVORITES by clicking on the plus icon.

The first rate displayed is the bid (sell) rate. The second rate is the ask (buy) rate. Most currency pair rates use five decimal places, with the fourth decimal place acting as the ‘pip’ and the fifth decimal place acting as the ‘pipette’. Some pairs use three decimal places (for example those with a rate currency of JPY, THB, or HUF). In this case, the pip is the second decimal place and the pipette is the third decimal place. To help you see a daily change, there are pips changes displayed in green/red under each currency pair. When there’s movement in the exchange rate for a currency pair, the up/down (green/red) indicators show you the change direction. These indicators help you track the currency pairs you aren’t currently viewing on the graph.
-
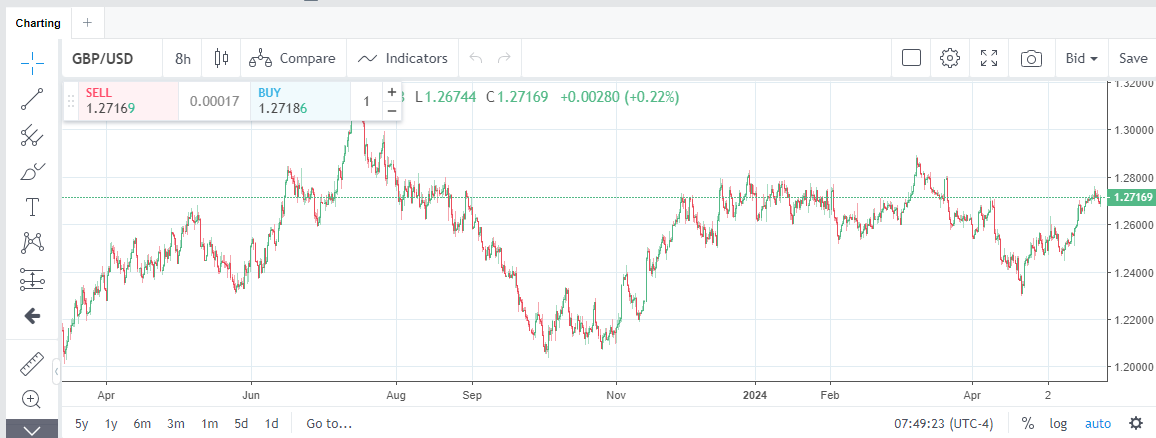
Optional: Analyze the prices on the charts which are only indicative (not tradable). Go to the Charting tab and click on the name of the instrument to open the graph for that instrument.
You can change the chart duration by clicking on the icon next to the instrument’s name that shows one of the following durations:
-
5 (5 sec)
-
1m (1 min)
-
5m (5 min)
-
15m (15 min)
-
30m (30 min)
-
1h (1 hour)
-
4h (4 hours)
-
D (1 day)
-
W (1 week)
-
Mo (1 month)
-
You can select the time zone for the chart scale from the bottom left on the chart
-
You can choose the price range to be used for daily candles from Preferences > Candle Preferences > Daily Candle Start/End Time. Default setting is 5pm ET
-
You can select Bid
The prevailing buy price., AskThe prevailing sell price. or Mid prices from the toggle in the top right corner.
-
-
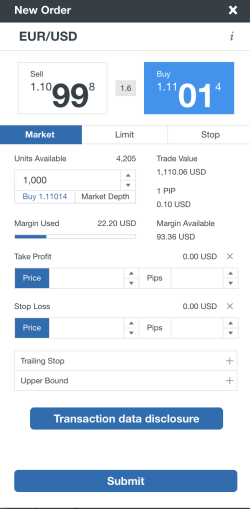
Click on BUY or SELL for any instrument from Charting or Instruments.
-
Optional: Click on the i icon for the instrument information.
-
Select Market, Limit or Stop.
-
Enter the trade volume in units.
In case of Limit or Stop orders, additionally enter the price at which the order should trigger and the expiry time after which the order should expire.
Expiry is set to 1 week by default. You can change it by clicking on it. You can choose from hours, days or months. For example, when you set it to 1 Day, it will expire 24 hours from the time the order was placed, not at the end of the current day or market session. It means an order placed on 28 Nov 2023 at 11:30 am will expire on 29 Nov 2023 at 11:30 am. The same logic applies to other time frames. -
Optional: Enter Take Profit or Stop Loss and Trailing Stop prices. You can also enter Upper Bound prices for buy orders and Lower Bound prices for sell orders.
-
Click on Submit.
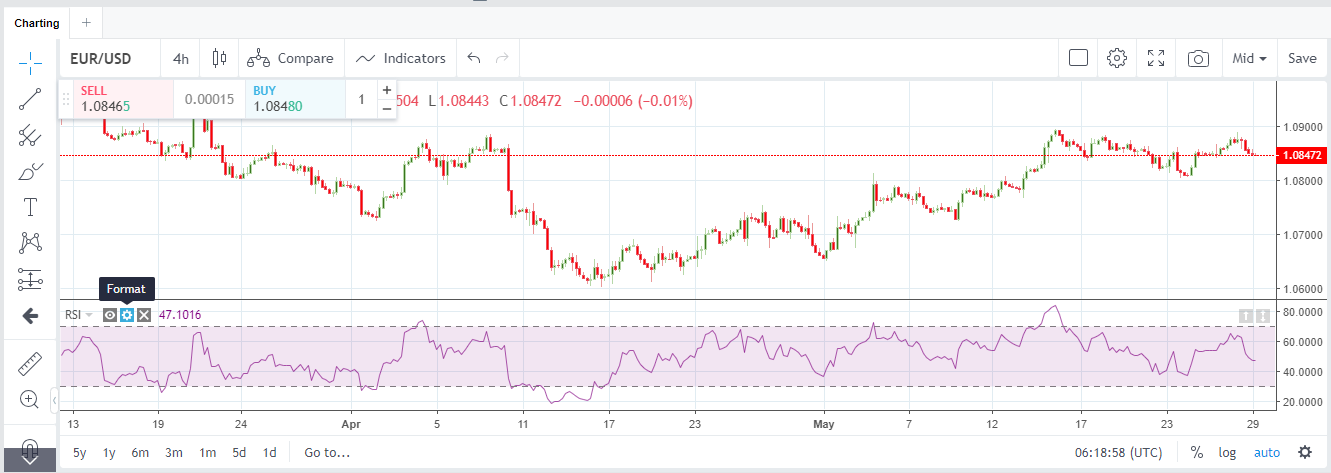
How to add indicators
-
On the Charting tab, click on Indicators.
-
Click on the desired indicator.
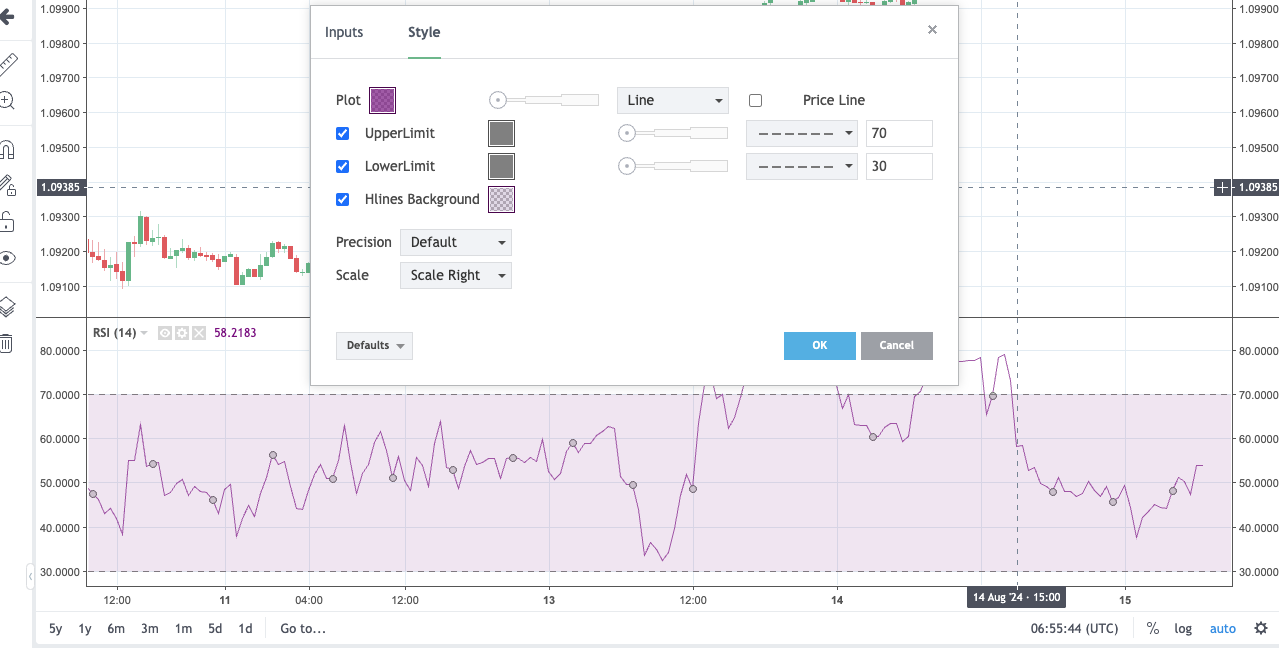
How to modify indicator parameters
-
On the added indicator, click on the gear icon, next to the indicator’s name.
-
Modify the indicator’s parameters.
-
To delete the indicator, click on the x icon.
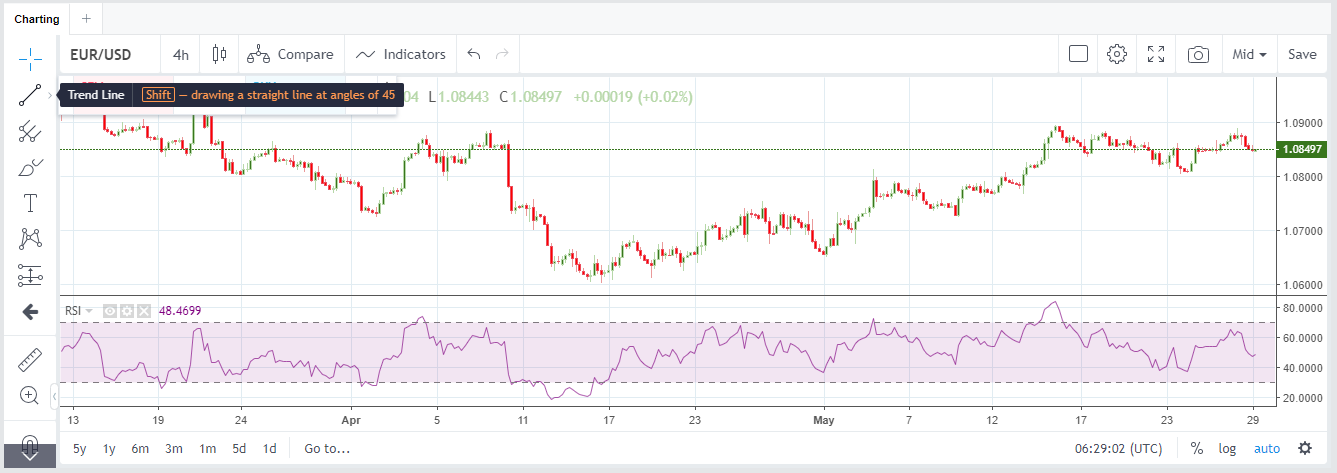
How to add drawing tools and trendlines
In this example, we will use the line drawing.
-
On the Charting tab, click on the line icon.
-
Select the desired line tool (for example, Trend Line, Horizontal Line or Info Line).
-
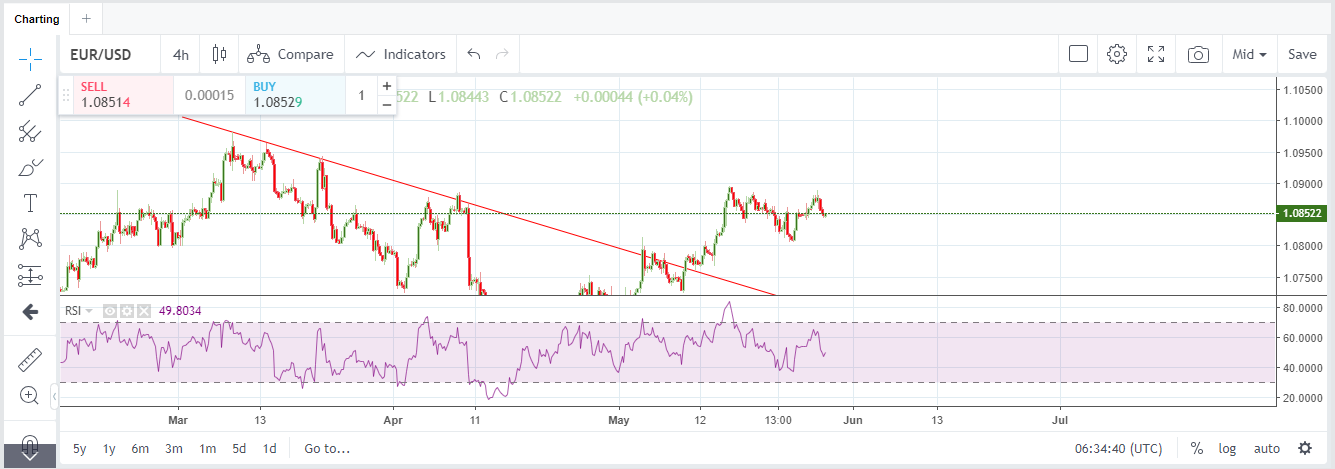
Click on the screen to draw.
-
Click anywhere on the screen to exit drawing mode.
How to modify drawing settings
-
Hover on your drawing on the graph. The cursor will change to a white handle.
-
Click and hold your mouse button to move your drawing.
-
Click on the drawing. The toolbar will be shown. Click on the trash icon to delete your drawing.
-
Click on the color icon and select the desired color to change it.

Which settings are available for chart customizations?
-
Click on the gear icon on the top right.
-
Select from Style, Scales, Background, Timezone/Sessions and Trading.
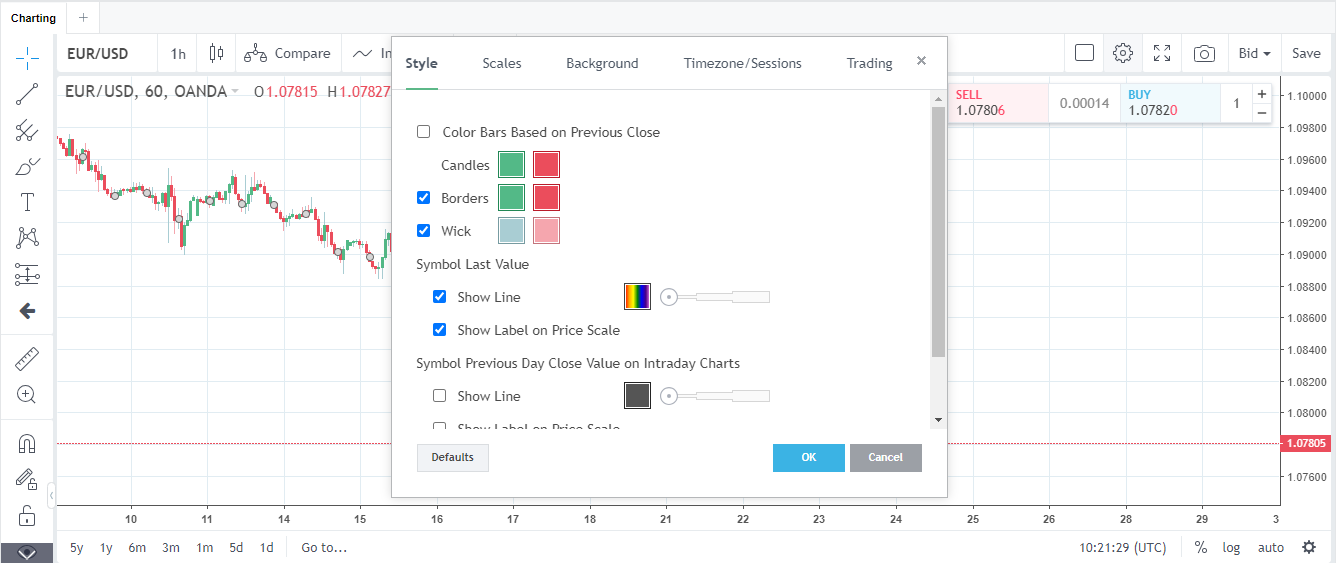
-
Once you have made your changes, click on OK.
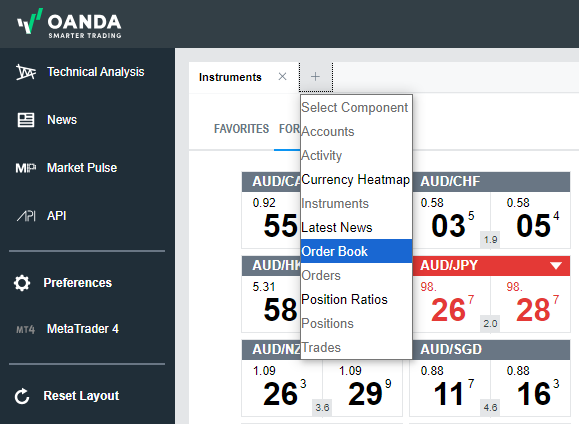
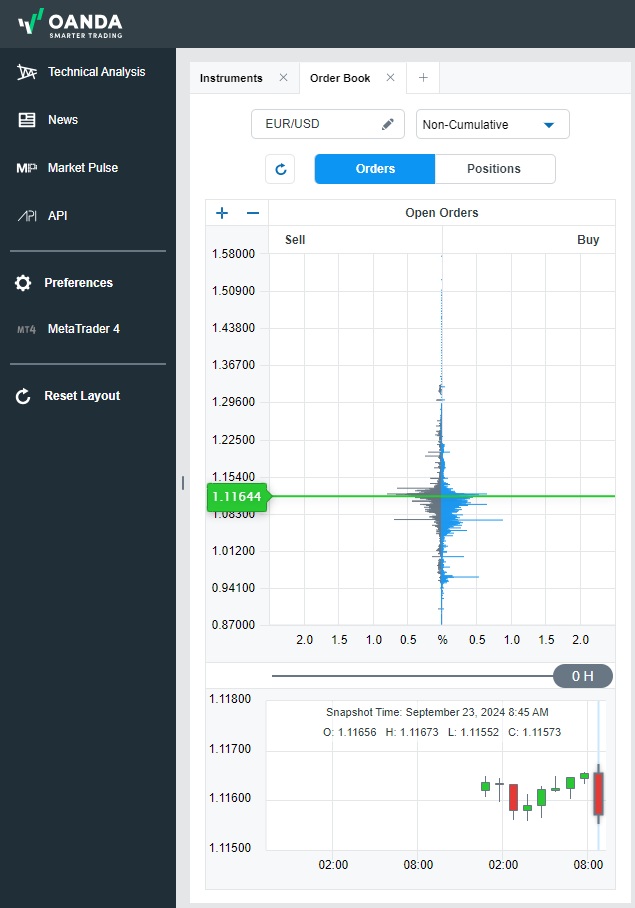
How to access the Order Book
The Order![]() An instruction to buy or sell an instrument under the specified conditions Book indicates whether most traders are buying or selling a particular instrument and the price level at which they are doing so. To access it, follow these steps:
An instruction to buy or sell an instrument under the specified conditions Book indicates whether most traders are buying or selling a particular instrument and the price level at which they are doing so. To access it, follow these steps:
-
Click on the plus sign next to the other tab(s) in the main section.
-
Select Order Book.
How to modify a trade
-
In the Trades tab, select your desired trade.
-
Click on the pencil icon.
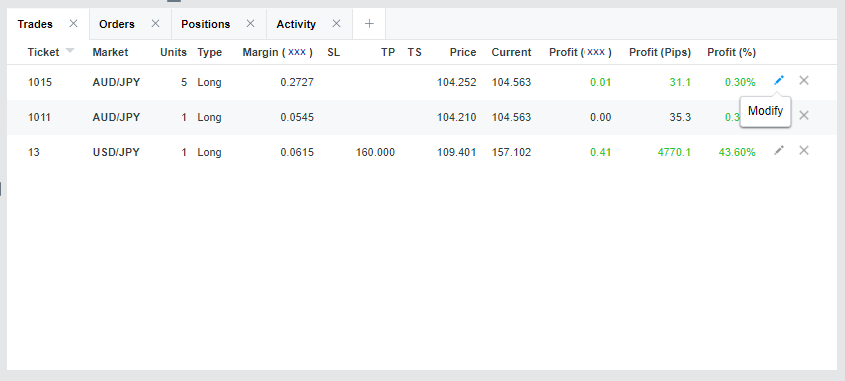
-
You can add or change all the clickable fields.
-
Click on Save Changes.
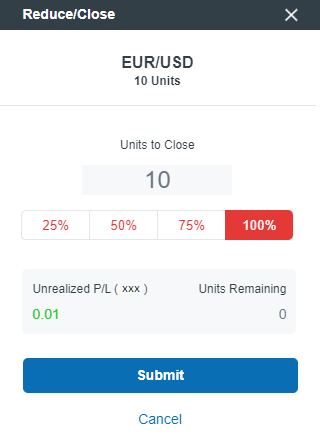
How to close or reduce a trade
-
In the Trades tab, select your desired trade.
-
Click on the x icon.
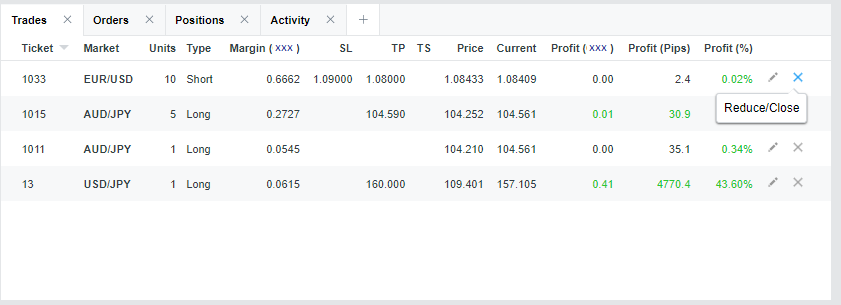
-
If you want to close the entire position, select 100% and click on Submit.
If you want to reduce a position, enter the number of units or the percentage of position you want to reduce and click on Submit.
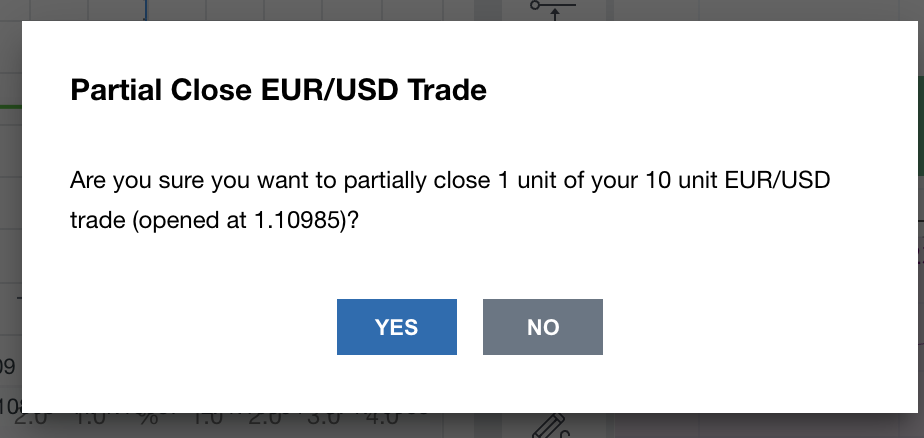
-
A verification window will appear for you to confirm the close or partial close of the trade. Click on YES to confirm the change.
How to modify a pending order
-
In the Orders tab, select your desired trade.
-
Click on the pencil icon.
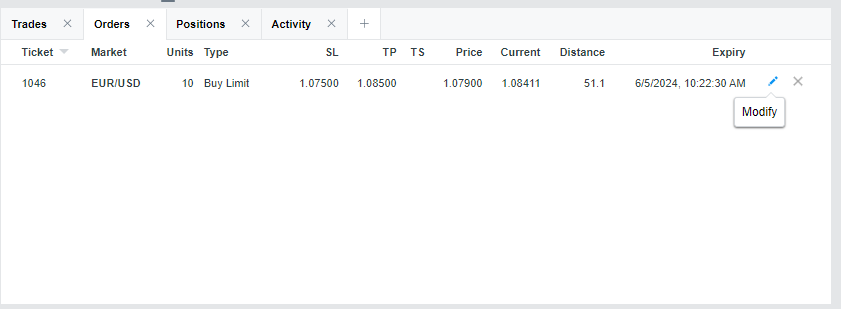
-
You can add or change all the clickable fields.
-
Click on Save Changes.
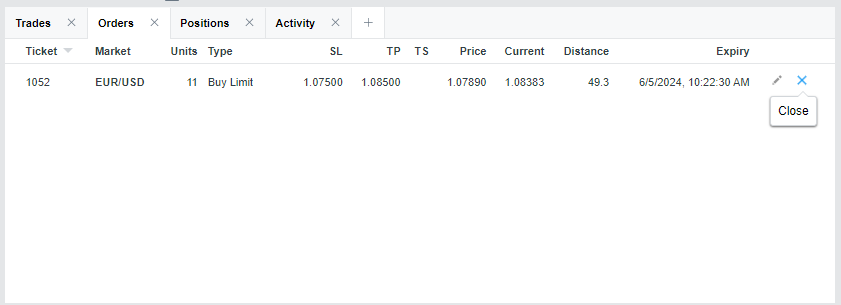
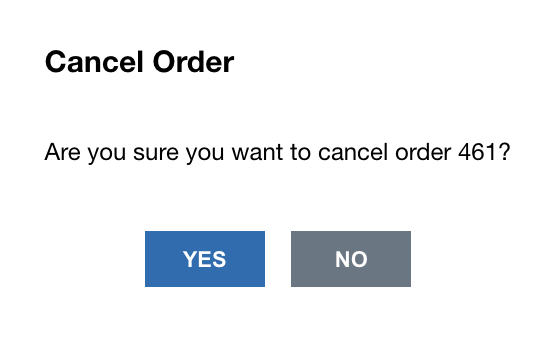
How to cancel a pending order
-
In the Orders tab, select your desired trade.
-
Click on the x icon.
-
A verification window will appear for you to confirm the close of the order. Click on YES to confirm the change.
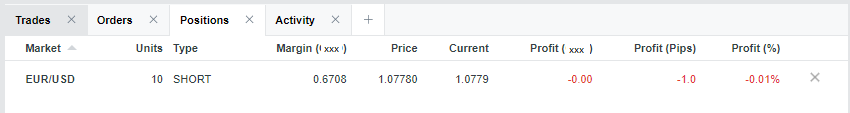
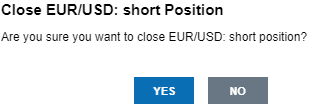
How to cancel a position
-
In the Positions tab, select your desired trade.
-
Click on the x icon.
-
A verification window will appear for you to confirm the close of the position. Click on YES to confirm the change.
How to add instruments to the FAVORITES tab
You can add any instrument to the FAVORITES tab. In the following example, we will add a currency pair to the FAVORITES tab:
-
At the screen bottom, click on the pencil icon to open a filter window.
-
To add a currency pair to your FAVORITES tab, click on the green plus sign next to the desired currency pair. The pair will be added and the green plus sign will change to the red x sign.
-
If you want to move a currency pair’s position, go to the FAVORITES tab, click on the 3 lines icon, hold, and drag a currency pair to the desired place.
-
To remove a currency pair from your favorites, go to the FAVORITES tab and click on the red x sign next to the desired currency pair. The currency pair will disappear from the view.
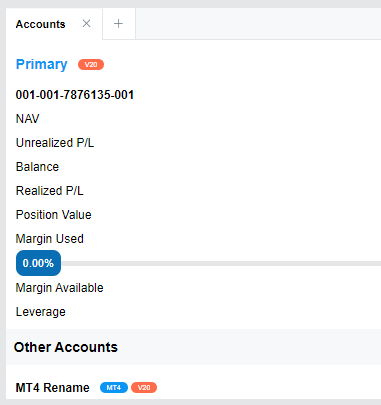
Where can I find my account balance?
Click on the Accounts tab, which shows the following:
-
NAV = Unrealized P/L + Balance
-
Unrealized P/L = The potential profit or loss if the open position were closed at that time
-
Balance = The amount of funds in the account, not including unrealized profit or loss
-
Realized P/L = The profit or loss on a completed trade
-
Position Value = The current market value of the portfolio position
-
Margin
The required collateral to open and maintain a leveraged position. Used = The margin currently in use to maintain open trades -
Margin Available = The amount of money available to be used as margin to open a new trade
-
Margin Closeout % = (50% of Margin Used/NAV_mid
NAV calculated at the current mid prices only for margin calculations.) x 100 where where mid-prices are used to calculate UPL_midUnrealised P/L calculated using the current mid prices for margin calculations in NAV_mid -
Leverage
The use of borrowed capital to open positions larger than what the actual capital permits. = The maximum leverage level available
What timezone is used to show date/time on the app?
The OANDA web platform shows the execution time in the time zone that is local to each client.
All price lists and charts use the timezone you selected from Preferences in the left navigation bar.
Where can I find statements & reports?
-
Click on Account Statements.
-
Once you are in the HUB, click on Reports.
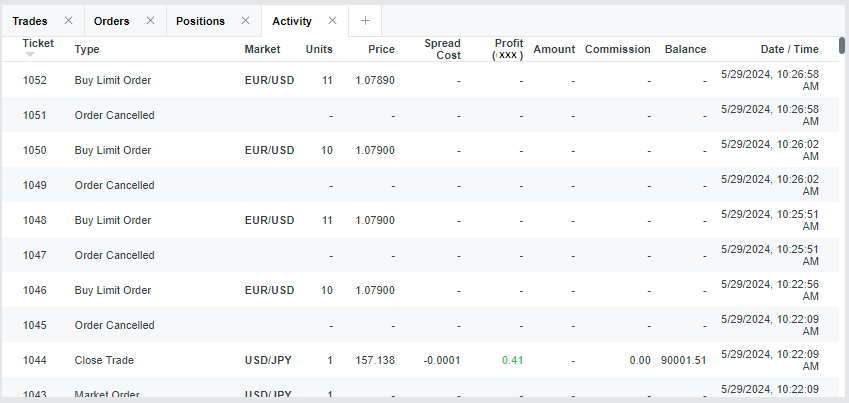
How to review your trade activity
Click on the Activity tab, which shows the following columns:
-
Ticket = The number that uniquely identifies the trade. You can use this number as a reference for inquiries with OANDA
-
Type = The trade type. For example, Market order
An instruction to buy or sell an instrument at the current market price., Buy Limit Order or Order Cancelled. -
Market = The instrument that was traded
-
Units = The number of units that were traded
-
Price = The price for the trade
-
Spread
The difference between the bid and the ask price. Cost = The spread cost for the trade -
Profit = The profit for the trade shown in the currency of the selected account
-
Amount = The daily financing fee
-
Commission = The commission for the trade
-
Balance = The amount of funds in the account, not including unrealized profit or loss
-
Date/Time = The date and time when a trade happened
How to change preferences
-
Click on Preferences.
-
Once you have made the desired changes, click on Save.
Why am I not able to submit a trade?
Your trading account may be locked due to numerous reasons. You may see an error message—Trading on this account is disabled. You can still close existing positions. In case of questions please contact our client experience team.