User guide for OANDA mobile app
 How to download the OANDA app
Download the OANDA app from the Apple App Store or Google Play.
What are the requirements for using the OANDA mobile app
You must download the OANDA app on your Android or iOS device. The OANDA app is compatible with Android 5.0 or higher, and iOS 14 or higher operating systems.
How to log in
Refer to the login FAQs. If you are unable to log in, refer to our troubleshooting guide.
How to switch between sub-accounts
-
In the top left corner, click on the avatar icon.
-
Scroll up or down if you have multiple sub-accounts.
-
Tap on the desired account to switch to it.
How to add funds
-
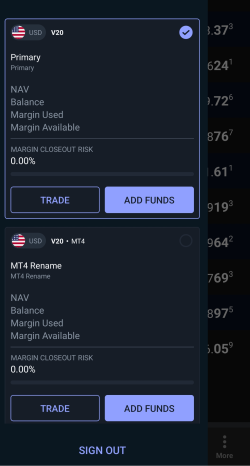
In the top left corner, click on the avatar icon.
-
Select the sub-account you want to fund and click on Add Funds.
-
Select your preferred payment method and complete the process. Refer to our deposit guide for more information.
How to place a trade
-
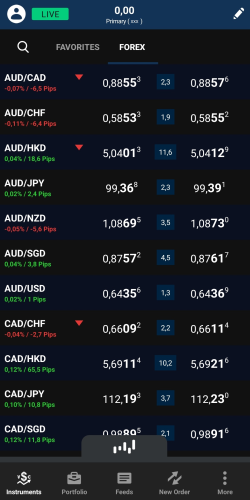
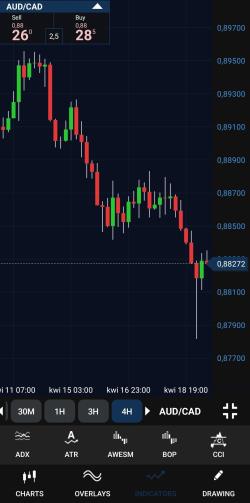
In the bottom bar, make sure you have selected Instruments. You can see all the instruments you can trade in. Tap on the different category tabs or the Favorites tab to find the relevant instruments. You can also use the magnifying glass icon to search for a specific instrument using the exact text.
The first rate displayed is the bid (sell) rate. The second rate is the ask (buy) rate. Most currency pair rates use five decimal places, with the fourth decimal place acting as the ‘pip’ and the fifth decimal place acting as the ‘pipette’. Some pairs use three decimal places (for example those with a rate currency of JPY, THB, or HUF). In this case, the pip is the second decimal place and the pipette is the third decimal place. To help you see a daily change, there are daily % and pips changes displayed in green/red under each currency pair. When there’s movement in the exchange rate for a currency pair, the up/down (green/red) indicators show you the change direction. These indicators help you track the currency pairs you aren’t currently viewing on the graph.
-
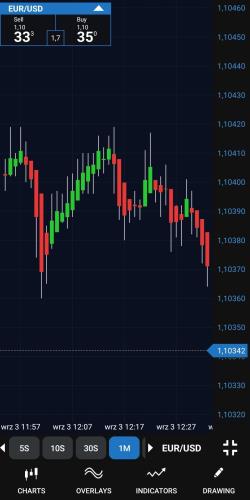
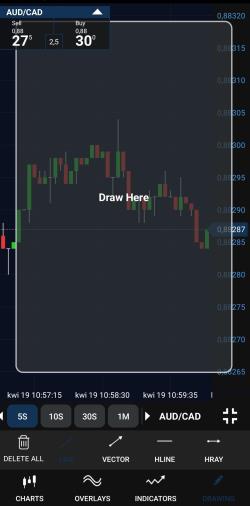
Optional: Analyze the prices on the charts which are only indicative (not tradable). Click on the name of the instrument and then click on the graph icon at the bottom of the screen (above the navigation panel) to open the graph for that instrument. To close the graph, click again on the graph icon.
You can change the chart duration by clicking on the bottom icon that shows one of the following durations:
-
5S (5 sec)
-
10S (10 sec)
-
30S (30 sec)
-
1M (1 min)
-
2M (2 min)
-
5M (5 min)
-
10M (10 min)
-
15M (15 min)
-
30M (30 min)
-
1H (1 hour)
-
3H (3 hours)
-
4H (4 hours)
-
8 H (8 hours)
-
D (1 day which means 24 hours)
-
W (1 week)
-
M (1 month)
-
-
The chart scale uses the local timezone you selected in your device
-
You can choose the price range to be used for daily candles from More > Settings > Daily Candle Start/End Time. Default setting is 5pm ET
-
The candlestick chart shows the history of mid prices. You can add a bid or ask line chart if required.
-
Tap on Buy or Sell for any instrument.
-
Optional: Click on the i icon for the instrument information and market hours.
-
Select Market Order
An instruction to buy or sell an instrument under the specified conditions or Entry OrderAn instruction to buy or sell an instrument when its price reaches a predetermined level..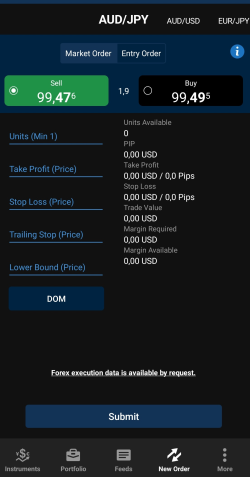
-
Enter the trade volume in units.
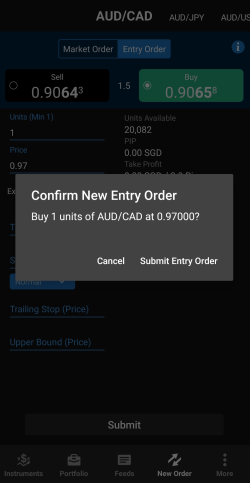
In case of Entry Order, additionally enter the price at which the order should trigger and the expiry time after which the order should expire.
Expiry is set to 1 week by default. You can change it by tapping it. You can choose from hours, days or months. For example, when you set it to 1 Day, it will expire 24 hours from the time the order was placed, not at the end of the current day or market session. It means an order placed on 28 Nov 2023 at 11:30 am will expire on 29 Nov 2023 at 11:30 am. The same logic applies to other time frames. -
Optional: Enter Take Profit or Stop Loss or Trailing Stop prices. You can also enter Upper Bound prices for buy orders and Lower Bound prices for sell orders.
-
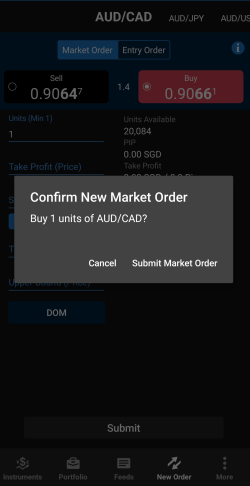
Click on Submit.
-
Click on Submit New Market Order or Submit New Entry Order as applicable.
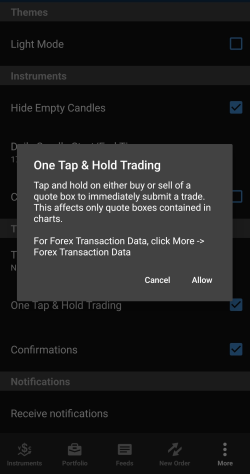
How to place a market order with the One Tap and Hold Trading option
-
Click on the More tab.
-
Tick the box next to the One Tap & Hold Trading option and click on Allow.
-
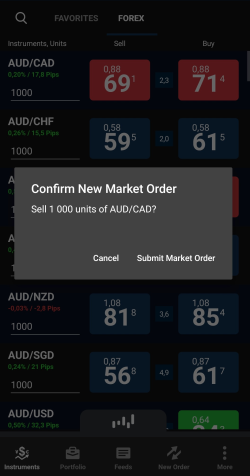
In the bottom bar, go to Instruments. Scroll to the currency pair that you want to trade and then tap and hold the Sell or Buy side of the rate. An orange circle will appear in the place where you are holding the rate.
-
A verification window will appear for you to confirm the new market order. Click on Submit Market Order.
How to add indicators
-
On the Instruments tab, tap on the instrument name.
-
At the bottom of the screen (above the navigation panel), click on the graph icon to open the graph.
-
Click on the full screen icon (above the More tab).
-
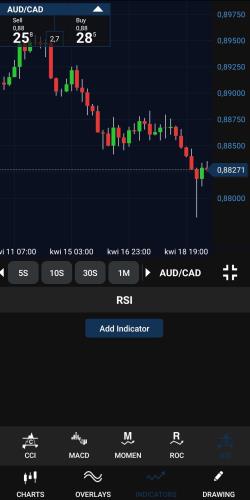
Click on Indicators. To add indicators in a landscape view, turn your device sideways.
-
Click on the desired indicator.
-
Click on Add Indicator.
-
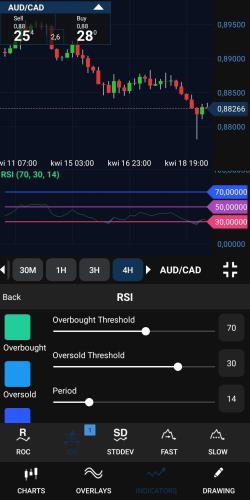
Modify the indicator’s parameters if you want.
How to modify indicator parameters
-
Click on the added indicator on the graph.
-
Modify the indicator’s parameters.
-
To delete the indicator, click on Indicators, find it and click on its name. Then click on the x icon.

How to add drawing tools and trendlines
-
On the Instruments tab, tap on the instrument name.
-
At the bottom of the screen (above the navigation panel), click on the graph icon to open the graph.
-
Click on the full screen icon (above the More tab).
-
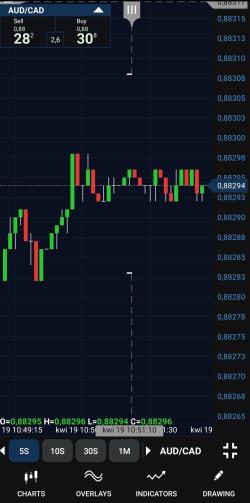
Click on Drawing. To draw in a landscape view, turn your device sideways.
-
Select a desired drawing tool (for example, LINE, VECTOR or HLINE).
-
Tap the screen to draw.
-
Tap anywhere on the screen to exit drawing mode.
How to modify drawing settings
-
Click on your drawing on the graph.
-
Use the white handle to move your drawing.
-
Click on the trash can icon to delete your drawing.
-
Click on the color icon and hold the desired color to change it.

How to modify a trade
-
From the bottom bar, click on Portfolio
A collection of financial instruments held by an investor or financial institution.. -
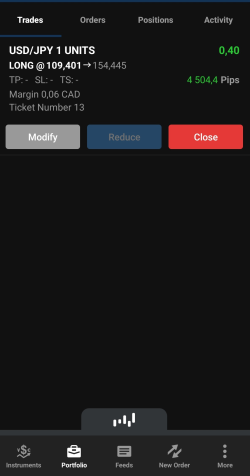
Click on Trades and select your desired trade.
-
Click on Modify.
-
You can add or change all the clickable fields.
-
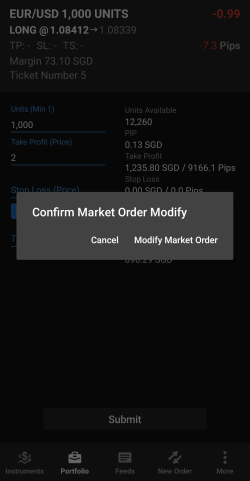
Tap Submit when you are done editing your order.
-
Click on Modify Order.
How to close or reduce a trade
-
From the bottom bar, click on Portfolio.
-
Click on Trades and select your desired trade.
-
If you want to close the entire trade, click on Close. Next, click on OK to confirm your intent.
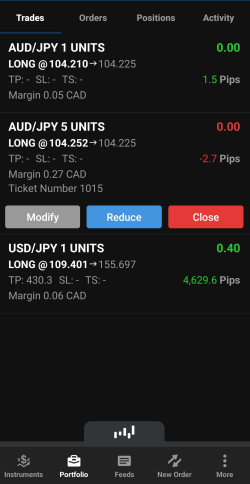
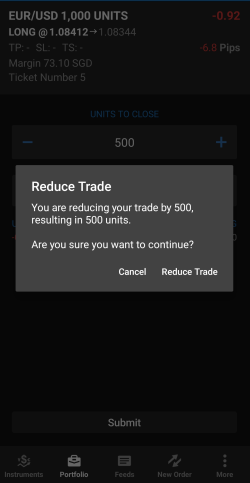
If you want to close a trade partially, click on Reduce. If you click on Reduce, you must enter the number of units or the percentage of trade you want to reduce. Entering one value will automatically calculate the other. Submit and click on Reduce Trade
The actual execution of buying or selling an asset, resulting in a completed transaction. to confirm your intent. 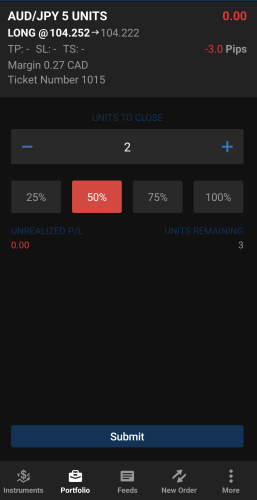
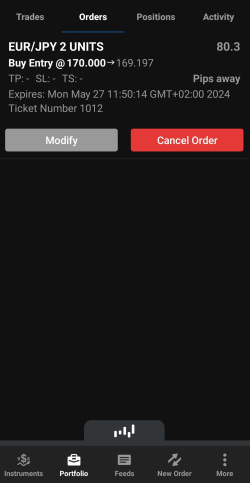
How to modify a pending order
-
From the bottom bar, click on Portfolio.
-
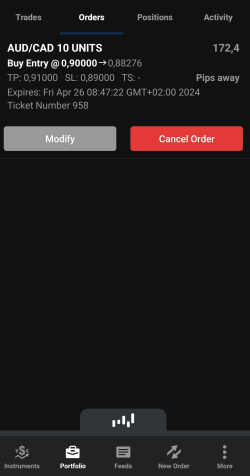
Click on Orders and select your desired order.
-
Click on Modify.
-
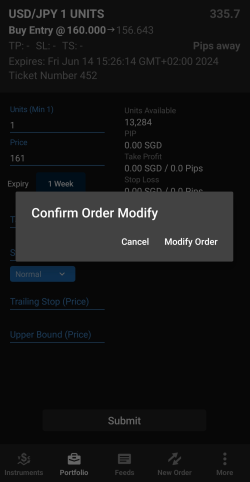
You can add or change all the clickable fields.
-
Tap Submit when you are done editing your order.
-
Click on Modify Order.
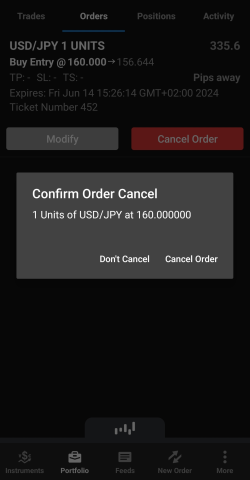
How to cancel a pending order
-
From the bottom bar, click on Portfolio.
-
Click on Orders and select your desired trade.
-
Click on Cancel Order.
-
Click on Cancel Order.
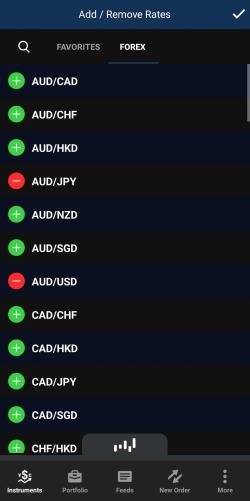
How to add instruments to the Favorites tab
You can add any instrument to the Favorites tab. In the following example, we will add a currency pair to the Favorites tab:
-
Click on the Forex tab.
-
In the top right corner, click on the pencil icon to open a filter window.
-
To add a currency pair to your Favorites tab, click on the green plus sign next to the desired currency pair. The pair will be added and the green plus sign will change to the red minus sign. Once you are done, click on the tick icon in the upper right corner.
-
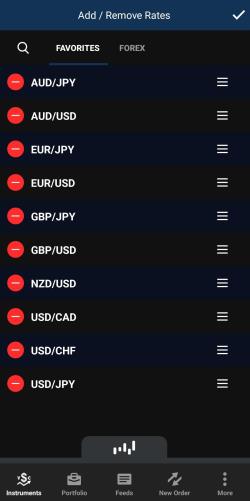
If you want to move a currency pair’s position, go to the Favorites tab, click on the 3 lines icon, hold, and drag a currency pair to the desired place.
-
To remove a currency pair from your favorites, go to the Favorites tab and click on the red minus sign next to the desired currency pair. The currency pair will disappear from the view. Once you are done, click on the tick icon in the upper right corner.
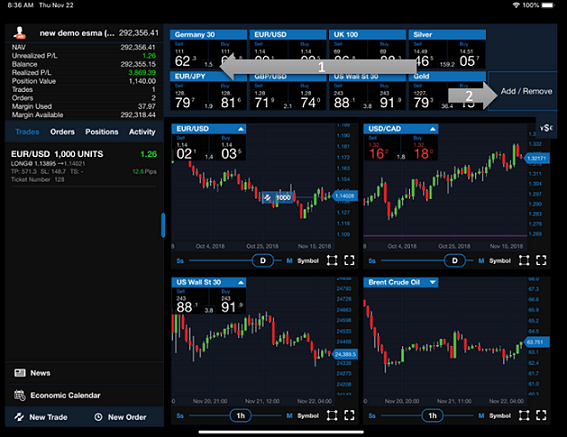
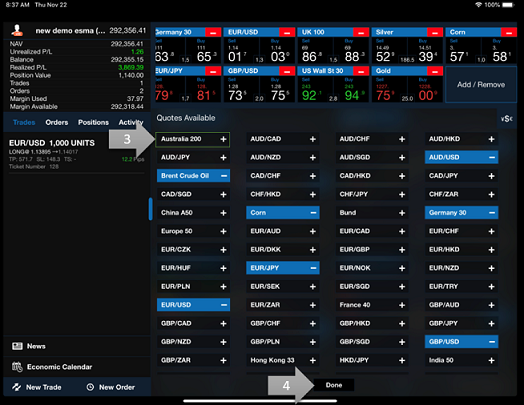
Swipe the Rates panel to the left.
Press Add/Remove.
Press the instrument name to add the CFD to your Rates panel.
Press Done to complete the addition.
Where can I find my account balance?
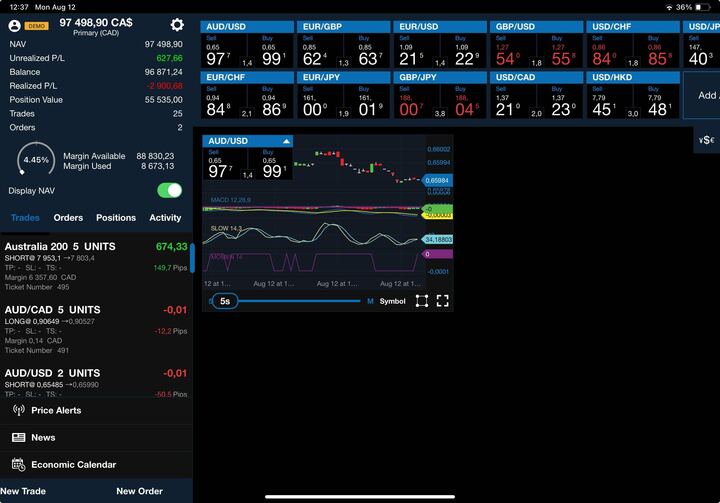
Click on the account and currency symbol shown on the top toolbar. The toolbar expands to show the following:
-
NAV = Unrealized P/L + Balance
-
Unrealized P/L = The potential profit or loss if the open position were closed at that time
-
Realized P/L = The profit or loss on the completed trades
-
Balance = The amount of funds in the account, not including unrealized profit or loss
-
Position Value = The current market value of the portfolio positions
-
Trades = The number of open trades
-
Orders = the number of open orders
-
Margin
The required collateral to open and maintain a leveraged position. Used = The margin currently in use to maintain open trades -
Margin Available = The amount of money available to be used as margin to open new trades
-
Margin Closeout % = (50% of Margin Used/NAV_mid
NAV calculated at the current mid prices only for margin calculations.) x 100 where mid-prices are used to calculate UPL_midUnrealised P/L calculated using the current mid prices for margin calculations in NAV_mid 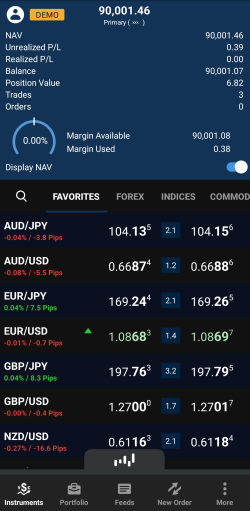
What timezone is used to show date/time on the app?
The app shows the trade execution and expiry time in the device’s local time.
Where can I find statements & reports?
-
Click on the More tab.
-
Click on Settings.
-
Click on Accounts.

-
Enter your login credentials in the HUB login window.
Once you are in the HUB, click on MENU to find Reports.
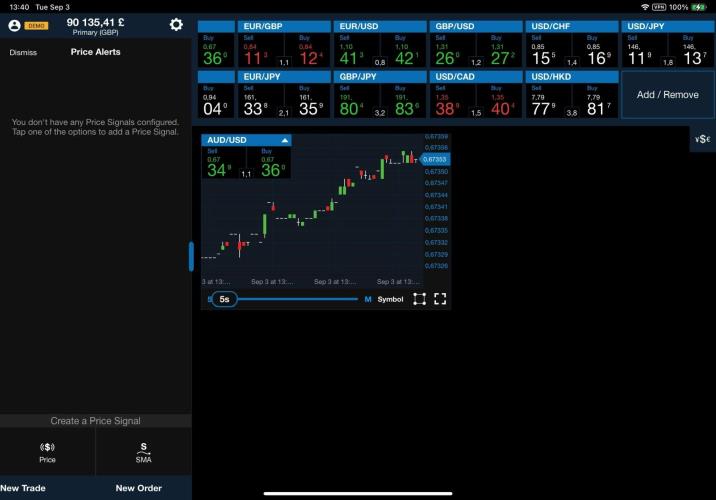
How to set up a price alert
To set up a price alert, follow these instructions:
-
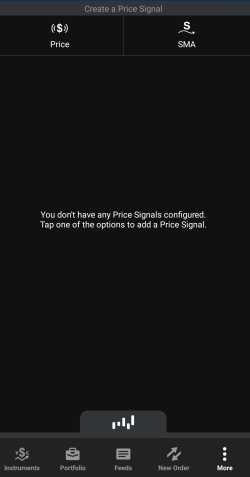
Click on the More tab.
-
Click on Price Signals.
-
Select Price or SMA (simple moving average).
-
Choose your desired instrument. If you cannot see the instrument, first add it to the Favorites and then select it.
-
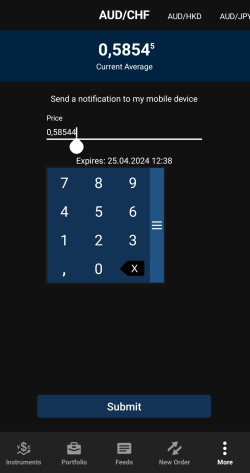
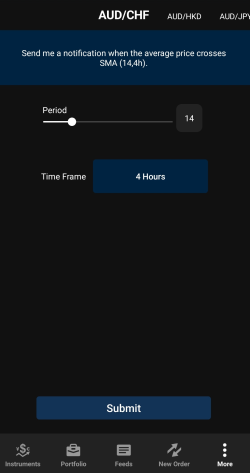
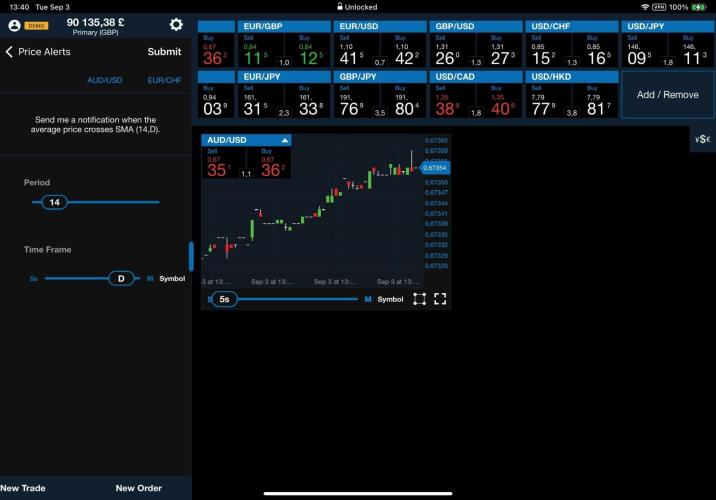
If you selected Price, enter your desired average price level for the price alert to trigger. The average price is the midpoint price between the bid and ask price where orders are executed. If you selected SMA, choose your desired period and time frame for SMA.
-
Tap Submit.
Click on Price Alerts.
Select Price or SMA (simple moving average).
Choose your desired instrument. If you cannot see the instrument, first add it to the Favorites and then select it.
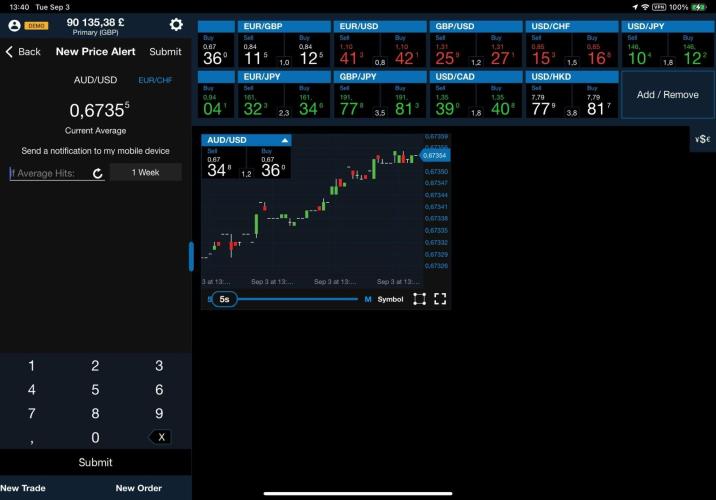
If you selected Price, enter your desired average price level for the price alert to trigger. The average price is the midpoint price between the bid and ask price where orders are executed. If you selected SMA, choose your desired period and time frame for SMA.
Tap Submit.
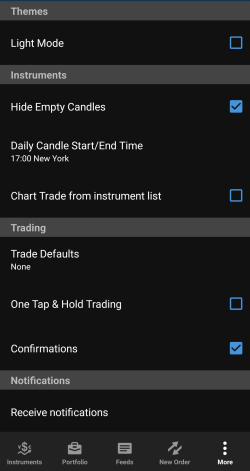
How to change settings
-
Click on the More tab.
-
Click on Settings.
-
Check a box next to the setting you want to set up. Changes are saved automatically.
Why am I not able to submit a trade?
Your trading account may be locked due to numerous reasons. You may see an error message—Trading on this account is disabled. You can still close existing positions. In case of questions please contact our Client Experience team.
What to do in case my device is lost or stolen?
To mitigate the risk of misuse of your trading account, please contact our client experience team and block your account at the earliest.
Why am I receiving a ‘device rooted or jailbroken’ message on the app?
For your security, we do not allow the use of jailbroken or rooted devices to prevent potential risks such as unauthorized access or data breaches. Please switch to a secure, non-jailbroken device to continue using the app.